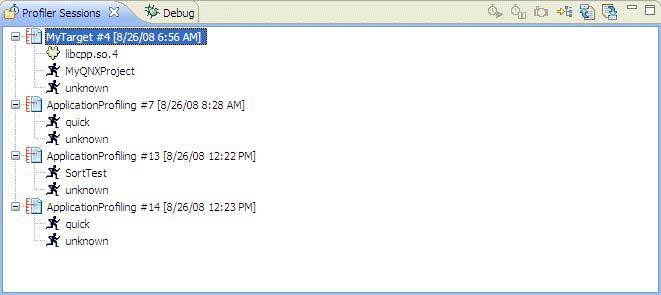
The Profiler Sessions view () lets you control multiple profiling sessions simultaneously. You can:
- export or import profiler data (see Exporting a profiler session)
- rename a session
- open or close a session
- compare sessions (see Comparing profiles)
- create a sample session (see Creating a sample profile session)
- start and stop the profiling of a running application
- take a snapshot of a running session (see Taking a snapshot of a profiling session)

The Profiler Sessions view.
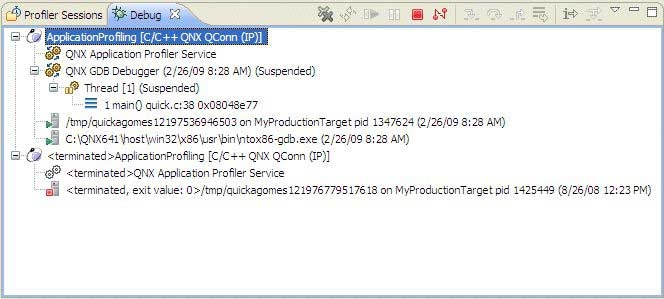
From the Debug tab, you can see more detail about the session:

The Debug tab for profile sessions.
The Profiler Sessions view shows the following as a hierarchical tree for each profiling session:
| Type | Description |
|---|---|
| Session ID | A consecutive identifier assigned to each profiler session. |
| Session Name | Launch instance name (i.e. ApplicationProfiling). |
| Session State | The current state of the session (open, closed) |
| Session Timestamp | The date and time the session was created. |
The icons that appear in the Profiler Sessions view are:
| Name | Icon |
|---|---|
| Running Process |
|
| Executable |
|
| Shared libraries |
|
| DLLs |
|
| Unknown |
|
A node named Unknown refers to a container for code that doesn't belong to any binary or library. Usually, this type refers to kernel code mapped to process virtual memory.
For Sampling and Call Count profiling, not all shared libraries or the binary appear in the tree view. The view can include only those libraries and binaries that were instrumented with Call Count instrumentation, or those that have corresponding samples during the execution. If the application runs for a short period of time (less than ten seconds), a library might not even have a single probe.
For Function Instrumentation, profiling only an instrumented binary and libraries would display in the tree view. System libraries, such as libc, would never appear in the view.
To choose which executable or library to show information for in the Execution Time view:
- In the Profiler Sessions view, click one of the following:
- a session
- an executable
- a shared library
- a DLL
To terminate an application running on a target:
- In the Debug view, select a launch configuration.
- Click the Terminate button (
 ) in the title bar of the corresponding Console view.
Note: To clear old launch listings from this view, click the Remove All Terminated Launches button (
 ).
).
To disconnect from an application running on a target:
- In the Debug view, select a running profiler session.
- Select a QNX Application Profiler Service.
- Click the Disconnect button (
 ) in the view's title bar.
Note: To clear old launch listings from this view, click the Remove All Terminated Launches button (
 ).
).


