When you complete optimizing, it's useful to see what progress you've made. The comparison mode lets you easily see the difference between two profile sessions. You can continue to view data as a Call Tree or a Table, but instead of absolute time values, you see time differences.
For example, you can compare two profiles to evaluate results before and after function optimization. In Compare mode, each column shows the change in values compared to the other session. Time and Count columns show the new value minus the old value. If there's no new value match for an item, its old value is used. If no old value match exists, the item will have a + indicator beside the new value.
Comparing two profiler sessions.
In this case, you must have at least two Application Profiler sessions to compare.
To profile in this case, follow these steps:
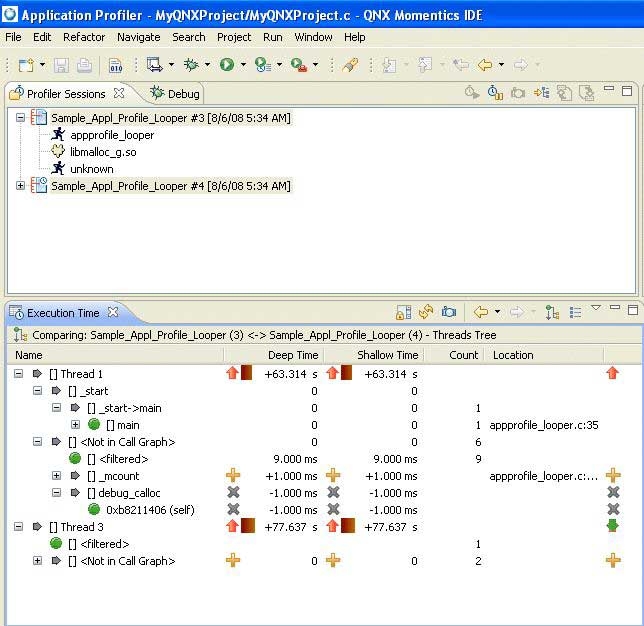
- In the Profiler Sessions view, select the two sessions that you want to compare.
- Right-click to open the context menu and select Compare menu time.
View the changes based on the results of the Comparison mode.
- The IDE shows colored arrows to indicate the old and new results for the selected sessions.
- Optional: You can use filters to remove insignificant results (<1% of difference), using Filter By:
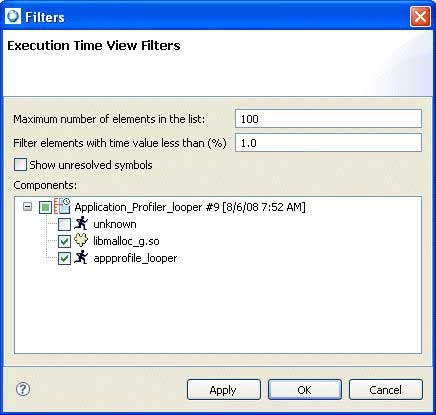
- From the Execution Time view toolbar menu, select Filters to open the Filter dialog.
- Specify any filtering criteria.
- Click OK.
After you profile
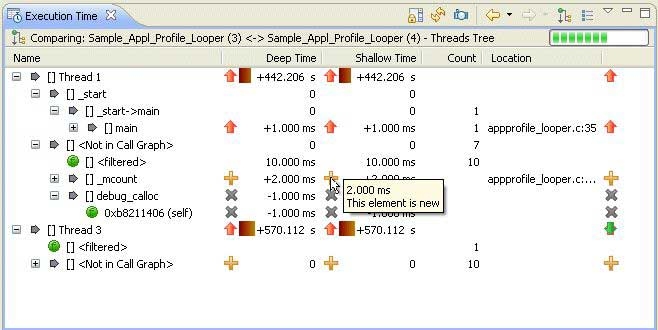
The Execution Time view shows the difference between two selected sessions, and you can observe these differences by:
- viewing the tooltips with the old and new values
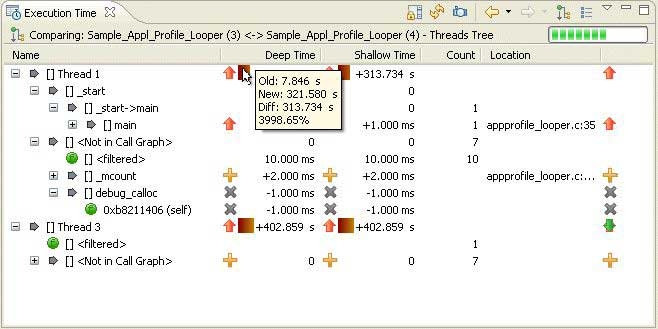
- observing the icons that indicate whether the element exist only in previous session (gray X), or new in the second session
(marked with an orange +)