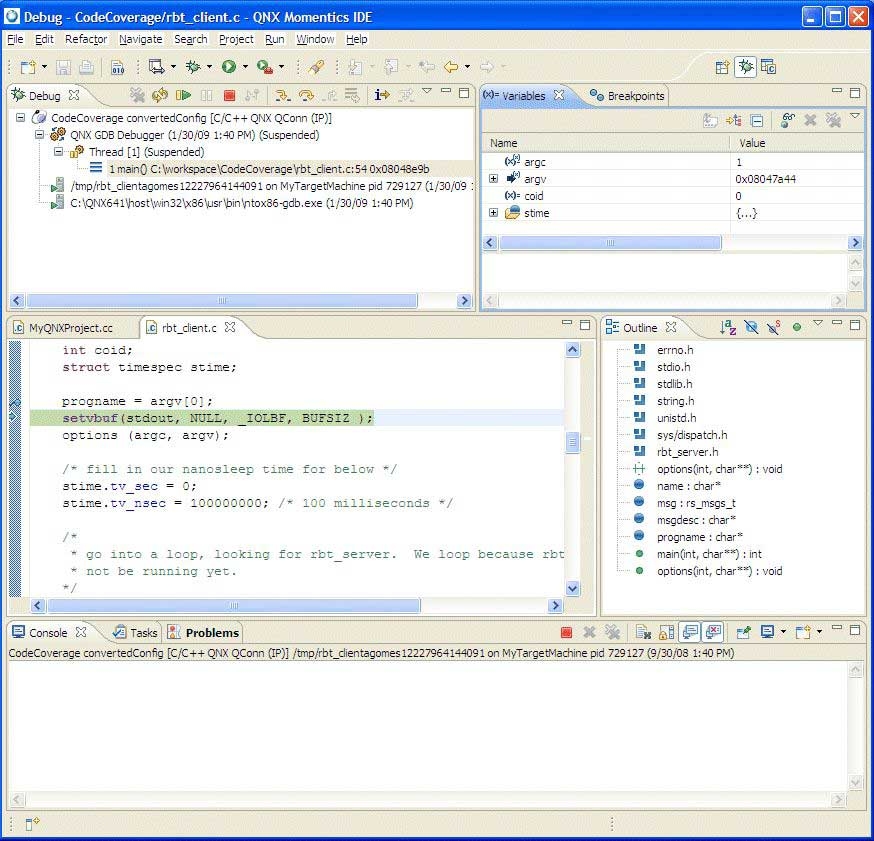
Once you've finished your debugging session, you should remove all breakpoints and click Continue to let startup finish booting up. A quick look at the serial console will show a fully-booted Neutrino image.
The following topics discuss the process of installing, configuring, and using the Lauterbach Trace32 In-Circuit Debugger with a QNX Neutrino kernel image, as well as describing the steps necessary to debug using the Debugger:
- Prerequisites
- Installing the Lauterbach Trace32 In-Circuit Debugger software
- Installing the Lauterbach Trace32 Eclipse plug-in software
- Connecting the Lauterbach Trace32 In-Circuit Debugger
- Configuring the Lauterbach Trace32 In-Circuit Debugger
- Creating a launch configuration for the target hardware
- Creating a startup script for the Lauterbach Trace32 In-Circuit software
Currently, the Lauterbach TRACE In-Circuit Debugger doesn't integrate with gdb.
The JTAG integration in the IDE is limited to source-level debugging of the source code only.
Since the Lauterbach Trace32 In-Circuit Debugger doesn't support Linux or Neutrino hosts, your host must run with Microsoft Windows.
The proper powering-up/down sequence is to power up the debugger first, and then the target, and the powering-down sequence is to power down the target, and then the debugger.
When prompted to specify a directory location, if you don't want to use the default directory specified, we recommended that you not use the system directory itself.
The IDE contains built-in support for the Abatron BDI2000 and Macraigor USB2Demon JTAG devices, with other device support through self-defined hardware-specific command sets.
The JTAG debug launch configuration supports GDB Hardware Debug through the JTAG interface.
For more information about the Lauterbach Trace32 In-Circuit Debugger, see the Lauterbach documentation and refer specifically to the ICD Debugger User's Guide, ICE User's Guide, and ICE User's Guide. Descriptions for all of the general commands are found in the IDE Reference Guide and General Reference Guide.
