The descriptions for the launch options for the Application Profiler tab are:
- Functions Instrumentation
- Capture detailed information about function behavior in the runtime. When selected, the profiling method is considered instrumented (function instrumented).
- Sampling and Call Count Instrumentation
- Provide statistical information based on probes driven by the timer interrupt.
- Single Application
- Profile a single process for a specific period of time; however, information about the context switches is not available.
- System Wide
- Generate profiling events as kernel log events so that later you can use the System Profiler tool to navigate the data. This means that the IDE doesn't monitor a specific program; it monitors all the processes that execute on a specific set of CPUs. Selecting this option generates only a few seconds' worth of data because of the large amount of data captured within that period of time. In order to capture kernel log events, you must enable System Profiling at the same time. To enable System Profiling, from the Tools tab for your launch configuration, Click Add/Delete Tool…, select the Kernel Logging tool, and then click OK.
- Save on the target, then upload
- Save the data by transferring it to the target machine, and then uploading the results.
- Upload while running
- Transfer the data while the process is currently running.
- Path on the target for profiler trace
- Define the location on the target machine of the profiler trace results file. The string ${random} would be substituted by a random number; this substitution runs for several sessions simultaneously.
- Remove on Exit
- Remove the resulting profiler trace file from target after the session ends.
- Use Pipe
- Create a pipe file on the target machine instead of a regular trace file. To use this option, the pipe daemon must be running on the target machine, and the file can only be created on the real filesystem (i.e. not /dev/shmem).
- Install start/stop hooks
- In function instrumentation mode, install signal handler to support profiler start/stop.
- Automatically start profiling
- When disabled, profiling won't start until profiling is explicitly started user intervention.
- Pause signal number
- Signal pauses the profiling data capture process.
- Resume signal number
- Signal resumes profiling data capturing.
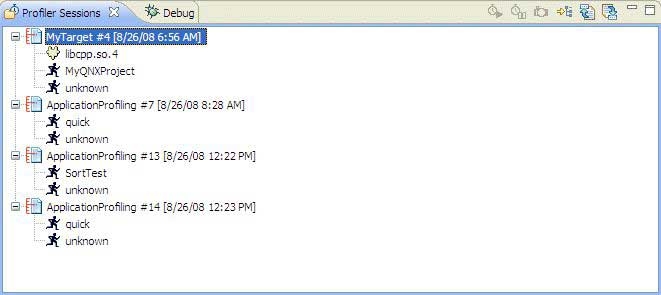
The Profiler Sessions view () lets you control multiple profiling sessions simultaneously. You can:
- export or import profiler data (see "Exporting a profiler session" in Profiler Sessions view)
- rename a session
- open or close a session
- compare sessions (see Comparing profiles)
- create a sample session (see "Creating a sample profile session" in Profiler Sessions view)
- start and stop the profiling of a running application
- take a snapshot of a running session (see "Taking a snapshot of a profile session" in Profiler Sessions view)

The Profiler Sessions view.
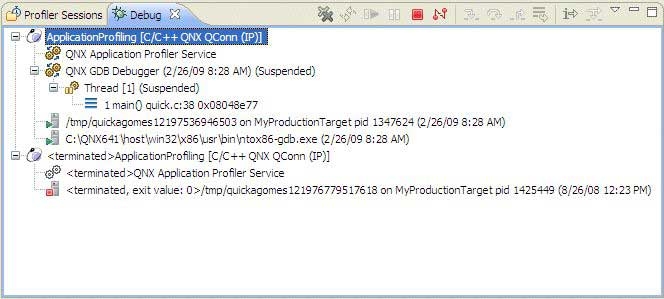
From the Debug tab, you can see more detail about the session:

The Debug tab for profile sessions.
The Profiler Sessions view shows the following as a hierarchical tree for each profiling session:
| Type | Description |
|---|---|
| Session ID | A consecutive identifier assigned to each profiler session. |
| Session Name | Launch instance name (i.e. ApplicationProfiling). |
| Session State | The current state of the session (open, closed) |
| Session Timestamp | The date and time the session was created. |
The icons that appear in the Profiler Sessions view are:
| Name | Icon |
|---|---|
| Running Process |
|
| Executable |
|
| Shared libraries |
|
| DLLs |
|
| Unknown |
|
A node named Unknown refers to a container for code that doesn't belong to any binary or library. Usually, this type refers to kernel code mapped to process virtual memory.
For Sampling and Call Count profiling, not all shared libraries or the binary appear in the tree view. The view can include only those libraries and binaries that were instrumented with Call Count instrumentation, or those that have corresponding samples during the execution. If the application runs for a short period of time (less than ten seconds), a library might not even have a single probe.
For Function Instrumentation, profiling only an instrumented binary and libraries would display in the tree view. System libraries, such as libc, would never appear in the view.
To choose which executable or library to show information for in the Execution Time view:
- In the Profiler Sessions view, click one of the following:
- a session
- an executable
- a shared library
- a DLL
To terminate an application running on a target:
- In the Debug view, select a launch configuration.
- Click the Terminate button (
 ) in the title bar of the corresponding Console view.
Note: To clear old launch listings from this view, click the Remove All Terminated Launches button (
 ).
).
To disconnect from an application running on a target:
- In the Debug view, select a running profiler session.
- Select a QNX Application Profiler Service.
- Click the Disconnect button (
 ) in the view's title bar.
Note: To clear old launch listings from this view, click the Remove All Terminated Launches button (
 ).
).
Other views within the QNX Application Profiler perspective show the profiling information for each item you select in the Profiler Sessions view.


