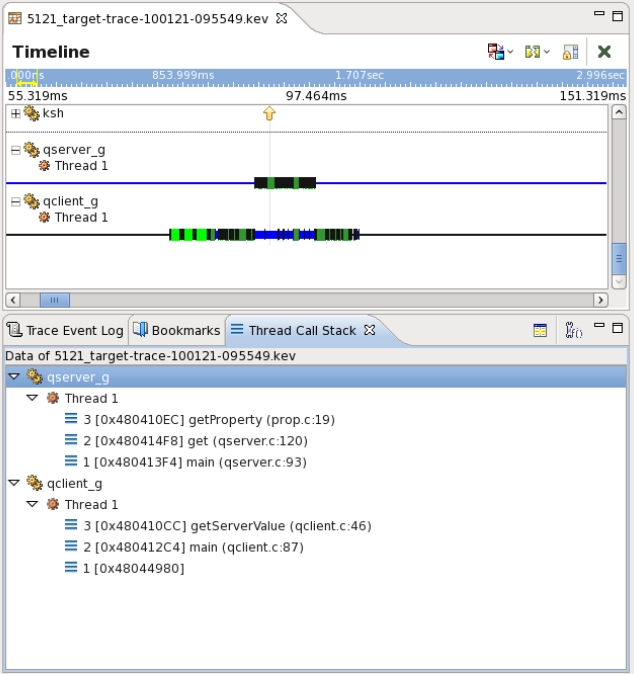
The Thread Call Stack view displays the current thread call stack at a given point in time for all instrumented threads.

When you profile an application with function instrumentation, the profiler records function enter and function exit events, and uses events to determine the stack at any point in a program.
Double-clicking on an entry in the Thread Call Stack view opens the associated source file. If one of the events in the Trace Event Log view is selected, it will appear highlighted in the Thread Call Stack view, and in the Timeline view. Double-click a stack entry to open the corresponding source file in the editor.
If the address translation (the property page of the .kev file) is properly configured for the trace, the call stack shows the function names, source files and line numbers. If it's not configured, the view shows only addresses.
On the Thread Call Stack view, there are two buttons:
| Icon | Name | Description |
|---|---|---|

|
Synchronize with editor filters | Adjusts the current data with the setting specified in the filters. |

|
Export to application profiler session | Takes the data from a .kev trace file and exports it to an Application Profiler session. |