Note: If your binary is instrumented with Mudflap, you can't run Memory Analysis on it because there will be a conflict (trying
to overload the same functions), and it will cause the program to crash.
To configure for error analysis:
Create a Run or Debug type of QNX Application launch configuration as you normally would, but don't click Run or Debug.
In the Create, manage, and run configurations dialog, click the Tools tab.
Click Add/Delete Tool.
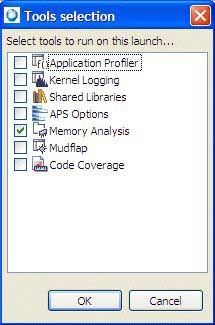
In the Tools Selection dialog, check Memory Analysis:
Click OK.
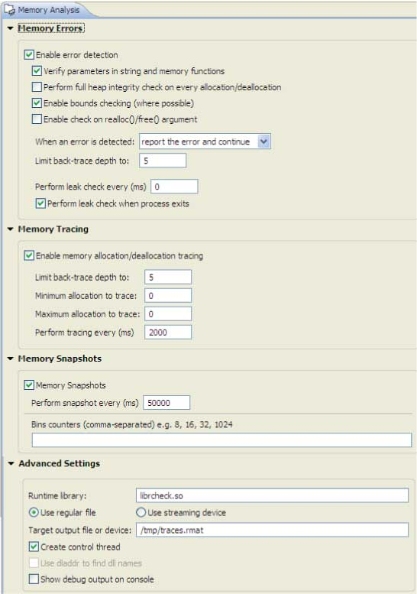
Click the Memory Analysis tab.
To configure the Memory Analysis settings for your program, expand the groups to view the appropriate set of options. For
more information about these settings, see Launching your program with Memory Analysis.
If you want the IDE to automatically change to the QNX Memory Analysis perspective when you run or debug, check Switch to this tool's perspective on launch.
Click Apply to save your changes.
Click Run, Debug, or Profile.
The IDE starts your program and lets you analyze your program's memory.
Note: Don't run more than one Memory Analysis session on a given target at a time, because the results may not be accurate.