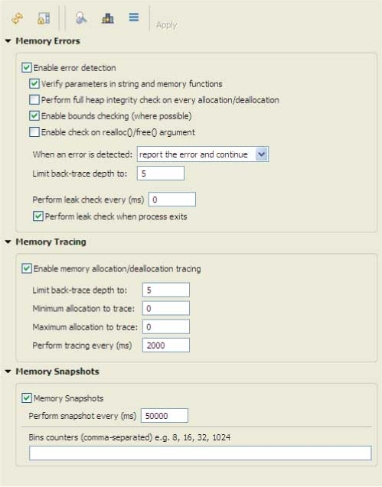
You can configure the Memory Analysis settings for a running program from the Settings tab:

Icons
| Icon | Description |
|---|---|

|
Update the current display with the latest data. |

|
Determine whether the IDE automatically refreshes the displayed information when streaming data from the target. When selected, you'll need to click Refresh to update the information. |

|
Gather information about any memory leaks encountered. |

|
Take a snapshot of the current results. |

|
Obtain a stack trace. |
Field descriptions
| Group/Field | Description |
|---|---|
| Memory Errors group | This group of configuration options controls the Memory Analysis tool's behavior when memory errors are detected. |
| Enable error detection | Detect memory allocation, deallocation, and access errors:
|
| When an error is detected | Memory Analysis takes the selected action when a memory error is detected. By default, it reports the error and attempts to continue, but you can also choose to launch the debugger or terminate the process. |
| Limit trace-back depth to | Specify the number of stack frames to record when logging a memory error. |
| Perform leak check every (ms) | Specify how often you want to check for leaks. Note that this checking comes with a performance penalty. |
| Perform leak check when process exits | When selected, look for memory leaks when the process exits, before the operating system cleans up the process's resources. |
| Memory Tracing group | This group of configuration options controls the Memory Analysis tool's memory tracing features. |
| Enable memory allocation/deallocation tracing | When selected, trace all memory allocations and deallocations. |
| Limit back-trace depth to | Specify the number of stack frames to record when tracing memory events. |
| Minimum allocation to trace | The size, in bytes, of the smallest allocation to trace. Use 0 to trace all allocations. |
| Maximum allocation to trace | The size, in bytes, of the largest allocation to trace. Use 0 to trace all allocations. |
| Perform tracing every (ms) | How often to collect information about your program's allocation and deallocation activity. When setting this, consider how often your program allocates and deallocates memory, and for how long you plan to run the program. |
| Memory Snapshots group | Control the Memory Analysis tool's memory snapshot feature to capture memory information at a specific time. |
| Memory Snapshots | Enable the capture of memory information to create a snapshot. |
| Perform snapshot every (ms) | Specify the number of milliseconds between each memory snapshot. |
| Bins counters (comma separated) ex: 8, 16, 32, 1024 ... | A comma-separated list of the memory bins you want to trace. |