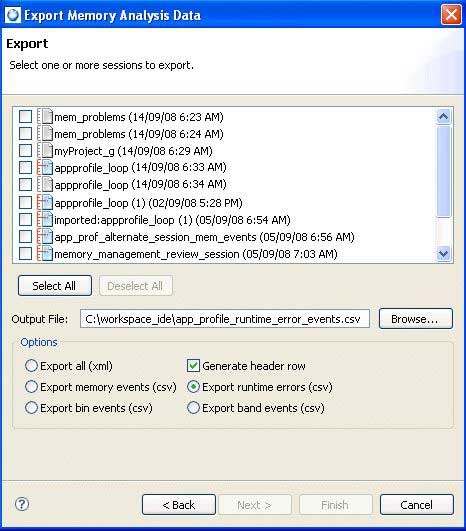
To export memory analysis data:
- Click .
- Select , and then click Next.
The list shows all of the memory analysis sessions that you accumulated.

- You can choose to export the data in the following two formats:
- To export data in XML format, from the list, select one or more memory analysis sessions that you want to export, or from the Options area, select Select All to choose all the sessions at once.
- To export data in CSV format (for descriptions about the format type, see Memory result formats):
- From the list, select one or more memory analysis sessions that you want to export, and from the Options area, select an event type that you want to export.
Memory events — export the allocation and deallocation of events over time.
Runtime errors — export runtime errors; these are the memory errors or leaks detected during the session.
Band events — export band events. The QNX allocator preallocates small buffers of memory for satisfying requests for small allocations, thereby improving your performance. These bands can handle allocations of up to 16, 24, 32, 48, 64, 80, 96, and 128 bytes in size. Band events would contain information about how many of these blocks are used and freed at any given time. In the Memory Analysis tool, the Bands pane shows a graphical representation for the activity in these bands.
Bin events — export the bin events information from the allocator. This allocator maintains counters to help gather statistics about how your application uses memory. Bins are user defined buckets of memory that the allocator keeps track of. Bin events are the number of bins of a given size that are used and freed at any given time. In the Memory Analysis tool, the Bins pane shows a graphical representation of the values for these counters over time.
- To include column headers for the data in the exported file, select the Generate header row checkbox.
- From the list, select one or more memory analysis sessions that you want to export, and from the Options area, select an event type that you want to export.
- In the Output File field, click Browse to select the output file you want to save the XML or CSV results in, or specify a new location and file name.
Note: If you select an output file that currently exists, you're prompted during the export process to click Yes to overwrite this file.
- To begin the export process, click Finish.
The resulting output file contains all of the memory analysis data for the selected session(s), based on your selected options.
CSV file format
When the IDE exports the event data in CSV format, the resulting data for the exported file contains different information depending on the type of event selected for export. For information about the detailed file format, see Memory result formats.