To estimate the average allocation size for a particular function call, find the backtrace of a call in the Memory Backtrace view. The Count column represents the number of allocations for a particular stack trace, and the Total Allocated column shows the total size of the allocated memory. To calculate an average, divide the Total Allocated value by the Count value.
Padding overhead
Padding overhead affects the struct type on processors with alignment restrictions. The fields in a structure are arranged in a way that the sizeof of a structure is larger than the sum of the sizeof of all of its fields. You can save some space by re-arranging the fields of the structure. Usually, it is better to group fields of the same type together. You can measure the result by writing a sizeof test. Typically, it is worth performing this task if the resulting sizeof matches with the allocator block size (see below).
Heap fragmentation
Heap fragmentation occurs when a process uses a lot of heap allocation and deallocation of different sizes. When this occurs, the allocator divides large blocks of memory into smaller ones, which later can't be used for larger blocks because the address space isn't contiguous. In this case, the process will allocate another physical page even if it looks like it has enough free memory. The QNX memory allocator is a bands allocator, which already solves most of this problem by allocating blocks of memory of constant sizes of 16, 24, 32, 48, 64, 80, 96 and 128 bytes. Having only a limited number of possible sizes lets the allocator choose the free block faster, and keeps the fragmentation to a minimum. If a block is more that 128 bytes, it's allocated in a general heap list, which means a slower allocation and more fragmentation. You can inspect the heap fragmentation by reviewing the Bins or Bands graphs. An indication of an unhealthy fragmentation occurs when there is growth of free blocks of a smaller size over a period of time.
Block overhead
Block overhead is a side effect of combating heap fragmentation. Block overhead occurs when there is extra space in the heap block; it is the difference between the user requested allocation size and actual block size. You can inspect Block overhead using the Memory Analysis tool:
In the allocation table, you can see the size of the requested block (11) and the actual size allocated (16). You can also estimate the overall impact of the block overhead by switching to the Usage page:
You can see in this example that current overhead is larger than the actual memory currently in use. Some techniques to avoid block overhead are:
You should consider allocator band numbers, when choosing allocation size, particularly for predictive realloc(). This is the algorithm that can provide you with the next highest power or two for a given number m if it is less than 128, or a 128 divider if it is more than 128:
int n;
if (m > 256) {
n = ((m + 127) >> 7) << 7;
} else {
n = m - 1;
n = n | (n >> 1);
n = n | (n >> 2);
n = n | (n >> 4);
n = n + 1;
}
It will generate the following size sequence: 1,2,4,8,16,32,64,128,256,384,512,640, and so on.
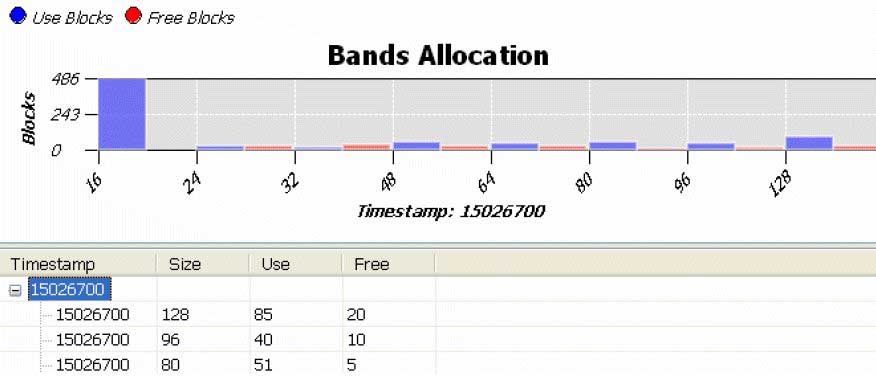
You can attempt to optimize data structures to align with values of the allocator blocks (unless they are in an array). For example, if you have a linked list in memory, and a data structure does not fit within 128 bytes, you should consider dividing it into smaller chunks (which may require an additional allocation call), but it will improve both performance (since band allocation is generally faster), and memory usage (since there is no need to worry about fragmentation). You can run the program with the Memory Analysis tool enabled once again (using the same options), and compare the Usage chart to see if you've achieved the desired results. You can observe how memory objects were distributed per block range using Bands page:

This chart shows, for example, that at the end there were 85 used blocks of 128 bytes in a block list. You also can see the number of free blocks by selecting a time range.
Free blocks overhead
When you free memory using the free() function, memory is returned to the process pool, but it does not mean that the process will free it. When the process allocates pages of physical memory, they are almost never returned. However, a page can be deallocated when the ratio of used pages reaches the low water mark. Even in this case, a virtual page can be freed only if it consists entirely of free blocks.