To use Mudflap in the IDE, you'll need to select Mudflap options to add the -fmudflapth option to the compiler command line for your application. There is a runtime library attached to the process called libmudflap that is controlled by runtime options that are automatically set in the MUDFLAP_OPTIONS environment variable (set when the Mudflap tool is added to the Launch Configuration; the Mudflap options are set there.) The instrumentation relies on this separate libmudflap runtime library that is linked into a program when the compile option (-fmudflap) and linker option (-lmudflap) are selected for the application. Note that both the QNX and Managed projects use the -fmudflapth option for the compiler and linker because this option supports threads (-fmudflap doesn't work with threaded programs.) This means that for multithreaded applications, you'll use -fmudflapth for the compiler, and -fmudflapth -lmudflapth for the linker.
-
To instrument a binary with Mudflap, do the following steps:
Note: If your binary is instrumented with Mudflap, you can't run Memory Analysis on it because there will be a conflict (trying to overload the same functions), and it will cause the program to crash.
- For a QNX project:
- In the Project Explorer, right-click on a project and select Properties.
- On the left, select QNX C/C++ Project to open the properties page.
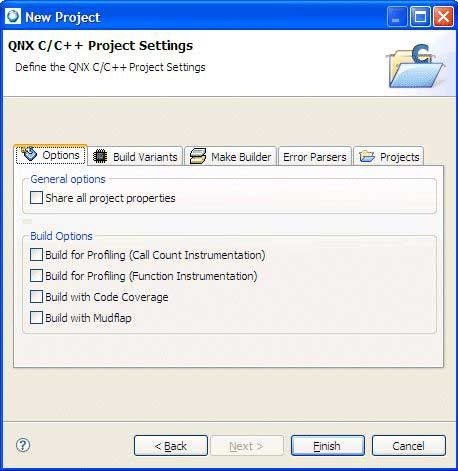
- On the Options tab, select the option Build with Mudflap by doing the following steps:

- On the Options tab, select Build with Mudflap.
- click OK.
- Rebuild the project ( File > Build Project ).
- For a Managed C/C++ project with a QNX toolchain:
- In the Project Explorer, right-click on a project and select Properties.
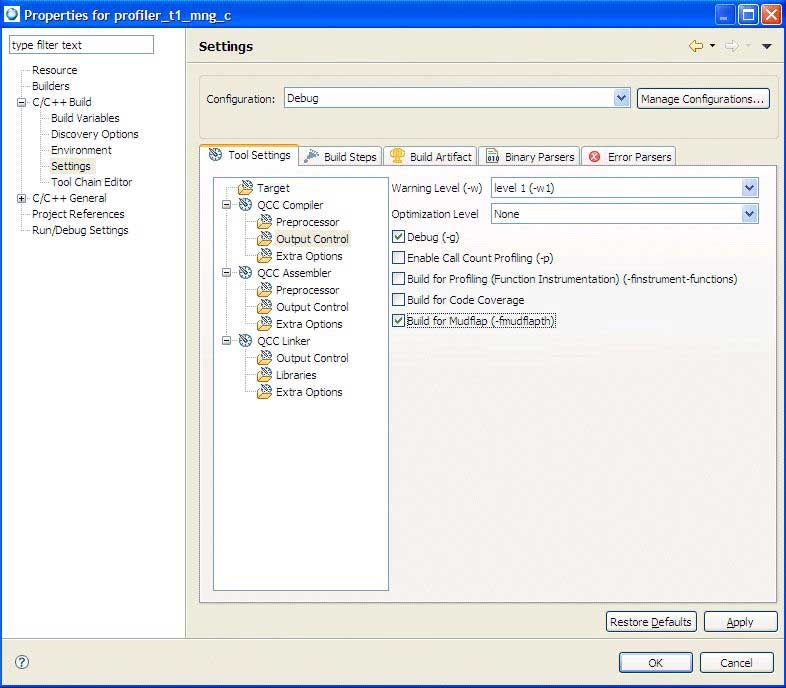
- Select C/C++ Build, and then select Settings to open the properties page.
- On the Tool Settings tab, expand QCC Compiler, and then select Output Control.
- Select the option Build with Mudflap.

- On the Tool Settings tab, expand QCC Linker, and then select Output Control.
- Select the option Build with Mudflap.
- Click OK.
- Rebuild the project ( File > Build Project ).
- For a QNX project:
-
To launch the instrumented binary with Mudflap enabled, do these steps:
- Right-click on a project and open a Launch Configuration dialog.
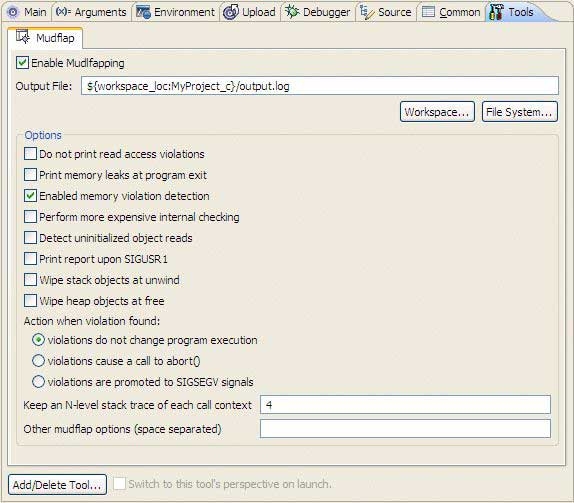
- Select the Tools tab, and then click Add/Delete Tool.
-
Select Mudflap from the list.
The IDE displays a Mudflap options page that lists the options that this Mudflap-enabled application can run with.

-
Select any desired Mudflap options. For detailed information about additional Mudflap options, see Options for Mudflap.
- Enable Mudflapping
- Sets the Mudflap feature to check for errors. Since Mudflap adds extra code to the compiled program to check for buffer overruns, Mudflap slows a program's performance (at build time, the compiler needs to process the instrumentation code). Consequently, you should only use Mudflap during testing, and turn it off in your production version.
- Output File
- Specify the location for the Mudflap output log file. Click Workspace… to specify a location in your workspace, or Filesystem… to specify a location your filesystem.
- Do not print read access violations
- Read access violations are not recorded. The Mudflap option for this feature is -ignore-reads.
- Print memory leaks at program exit
- When the program shuts down, print a list of memory objects on the heap that have not been deallocated. The Mudflap option for this feature is -print-leaks.
- Enabled memory violation protection
- Trigger a violation for every main() call. This option is useful as a debugging aid. The Mudflap option for this feature is -mode-violate.
- Perform more expensive internal checking
- Periodically traverse the internal structures to assert the absence of corruption. The Mudflap option for this feature is -internal-checking.
- Detect uninitialized object reads
- Verify that the memory objects on the heap have been written to before they are read. The Mudflap option for this feature is -check-initialization.
- Print report upon SIGUSR1
- Handle signal SIGUSR1 by printing the similar report that will be printed at shutdown. This option is useful for monitoring interactions of a long running program. The Mudflap option for this feature is -sigusr1-report.
- Wipe stack objects at unwind
- Clear each tracked stack object when it goes out of scope. This options is useful as a security or debugging measure. The Mudflap option for this feature is -wipe-stack.
- Wipe heap objects at free
- Clear each tracked heap object being deallocated when it goes out of scope. This option is useful as a security or debugging measure. The Mudflap option for this feature is -wipe-heap.
- Action when violation found
- Select a specific action for Mudflap to take when it encounters a violation.
violations do not change program execution — Violations don't change the program execution. This means that this option will do nothing and the program may continue with the erroneous access; however, this action may corrupt its own state, or the state of libmudflap. The Mudflap option for this feature is -viol-nop.
violations cause a call to abort() — A call is made to the abort() function when a violation is encountered, which then requests a core dump and exit. The Mudflap option for this feature is -viol-abort.
violations are promoted to SIGSEGV signals — Generate a SIGSEGV, which a program may choose to catch. The Mudflap option for this feature is -viol-segv.
- Keep an N-level stack trace of each call context
- Record N levels of tack backtrace information for each allocation, deallocation, and violation. The Mudflap option for this feature is -backtrace=N.
- Other Mudflap options (space separated)
- A field where you can specify additional Mudflap options. For information about these options, see Options for Mudflap
- Launch the application. The Mudflap session opens and shows the Mudflap Violation view that contains any errors that it encountered (the errors are recorded in the Mudflap output log file).
- Select an error from the list to navigate to the location of that error in the source code.