To begin debugging using the Abatron BDI2000 JTAG Debugger, you'll need to create a debug
configuration in the QNX Momentics IDE to upload an image into the target board's RAM,
and debug it through the JTAG pins.
To create a launch configuration for the Abatron BDI2000 Debugger:
-
In the Images directory in the System Builder Projects view,
right-click on the .elf file and select .
-
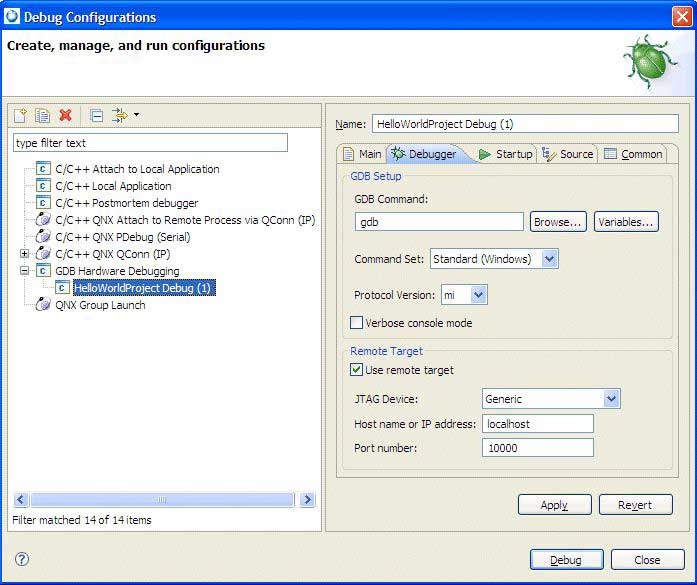
Create a new instance of the GDB Hardware Debugging debug
configuration.
-
On the Main tab, specify the name of your project, and select
the .elf file as the C/C++ Application. You want to select the
.srec or .elf image file that will be
uploaded straight to the target board's RAM through the JTAG pins.
-
Click the Debugger tab.
-
Change the GDB Command field to the path of a gdb
debugger appropriate for your target architecture (e.g.
ntoppc-gdb.exe).
-
In the Remote Target area, select the Use remote
target checkbox, ensure that the JTAG Device
combo box is set to Abatron BDI2000. From this list, you can
select which of the supported types of JTAG devices you want to use.
-
Verify that the Host name or IP address field is the IP
address assigned to the BDI2000 Debugger device. Unless otherwise specified on the
Debugger tab, the port number to use is 2001.
-
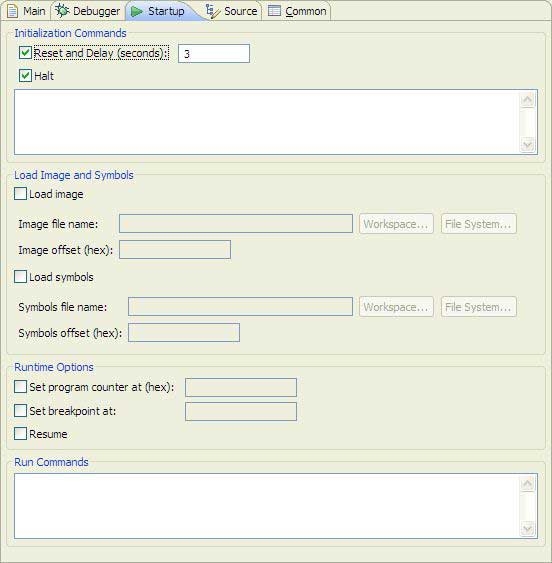
Click the Startup tab.
-
Select the Reset and Delay (seconds) checkbox, and type an
integer representing the number of seconds to wait between resetting the target
board and halting it to send the image. You should allow enough time to bring up all
the hardware.
Since just about every board loaded with a U-Boot, IPL, or a ROM
Monitor needs to wait a few seconds for the prompt before halting the processor
to send the image, a delay of 3 seconds is sufficient for waiting between
resetting the board and starting to load the image.
-
Select the Halt checkbox to stop the target in order to start
sending the image.
-
If there are any monitor commands you would like to execute before sending
the image to the target, type those commands in the Halt
field, separated those commands by newlines, making sure to prefix them with the
keyword monitor and a space. You don't need to add commands to restart or halt the
board here, as that is done automatically.
-
Check the Load image checkbox, and browse to the location of
the image file (i.e..elf). You want to select the
.srec or .elf image file that will be
uploaded straight to the target board's RAM through the JTAG pins.
-
In the Image Offset (hex) field, type the number previously
noted in the Properties view of the System Builder project.
-
Select the Load symbols checkbox, and browse to the location
of the Symbols file name
.sym file in the textbox below.
The symbols file provides
symbols for source-level debugging. For most BSPs, the symbol file has the same
filename as the image file, except for the file extension
(.sym). Note that the IDE would issue a warning message
if you didn't build the image with debug symbols. Leaving this textbox blank
would result in no debug symbols being loaded, resulting in assembly-level
debugging only.
Each of these two textboxes (the Symbols file
name and the Symbols offset (hex))is
paired with a Symbol offset field. In the case of
.elf files, the offset for the image can be parsed from
the binary itself; you'll need to manually specify the offset by looking at the
BSP-provided value.
-
In the Symbol offset (hex) field, type the value in the first
column in the console output, noted earlier.
-
Select the Set program counter at (hex) checkbox and type the
value in the third column of the console output noted earlier.
-
Select the Set breakpoint at checkbox and type the name of
the function you want to set the initial break point, for example
_main.
-
Select the Resume checkbox.
-
In the Run Commands field, type any GDB commands that you
would like to have automatically executed after the image and symbols have been
successfully uploaded to the target. For example, you can type the si
command at the end of this box in order to start stepping.
-
Click Apply.
-
Click Debug and begin debugging.