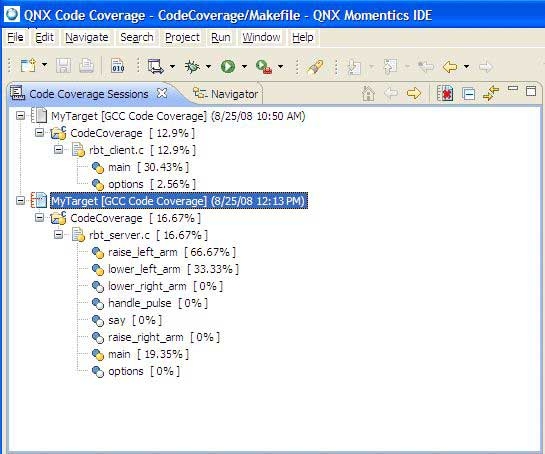
The Code Coverage Sessions view lets you control and display multiple code-coverage sessions:
Viewing Code coverage sessions in the Code Coverage Sessions view.
The view shows the following as a hierarchical tree for each session:
| Session item | Description | Possible icons |
|---|---|---|
| Code coverage session | Launch configuration name, coverage tool, and start time (e.g. ccov102_factor [GCC Code Coverage] (7/2/03 2:48 PM)) |
|
| Project | Project name and amount of coverage (e.g. ccov102_factor [ 86.67% ]) |
|
| File | Filename and amount of coverage (e.g. ccov102_factor.c [ 86.67% ]) |
|
| Function | Function name and amount of coverage (e.g. main [ 100% ]) |
|


The IDE uses several icons in this view:
| Icon | Icon Color | Meaning |
|---|---|---|
|
|
White | No coverage |
|
|
Yellow | Partial coverage |
|
|
Green | Full (100%) coverage |
|
|
(cell is highlighted) | Out-of-date source file |
| x | Red | An error marker to indicate some type of error (e.g. a code coverage data file was not found, or an error reading data or notes files). |


The IDE also adds a coverage markup icon ( ) to indicate source markup in the editor. (See the Examining data line-by-line section, below.)
To reduce the size of the hierarchical tree, you can click the Collapse All (  ) button.